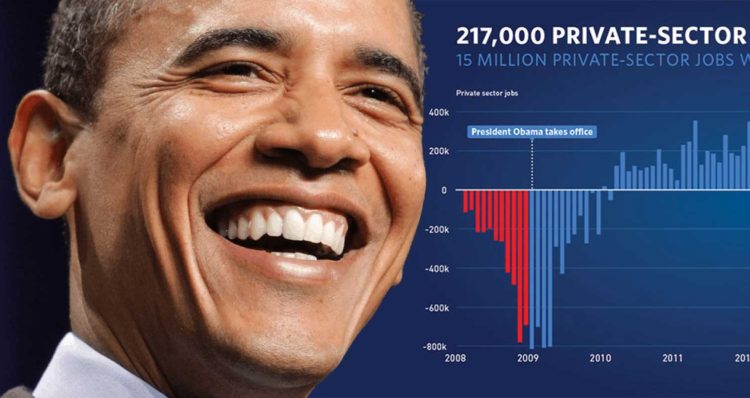
The Obama administration announces that our businesses have added 15 million jobs in the longest streak of job growth on record.
The Obama administration published a new report this week detailing the employment situation in July 2016.
The Employment Situation in July
Summary: The economy added 255,000 jobs in July, as the unemployment rate held steady and labor force participation rose, and wage growth picked up.
The economy added 255,000 jobs in July following robust job growth in June, as the unemployment rate held steady at 4.9 percent and labor force participation rose. U.S. businesses have now added 15.0 million jobs since private-sector job growth turned positive in early 2010, and the longest streak of total job growth on record continued in July.
So far in 2016, job growth has averaged a solid 186,000 jobs a month, well above the pace needed to maintain a low and stable unemployment rate, and nominal hourly earnings for private employees have increased at an annual rate of nearly 3 percent so far in 2016, much faster than the pace of inflation.
Nevertheless, more work remains to sustain faster wage growth and to ensure that the benefits of the recovery are broadly shared, including investing in infrastructure, implementing the high-standards Trans-Pacific Partnership, raising the minimum wage, and guaranteeing access to paid parental leave.
FIVE KEY POINTS ON THE LABOR MARKET IN JULY 2016
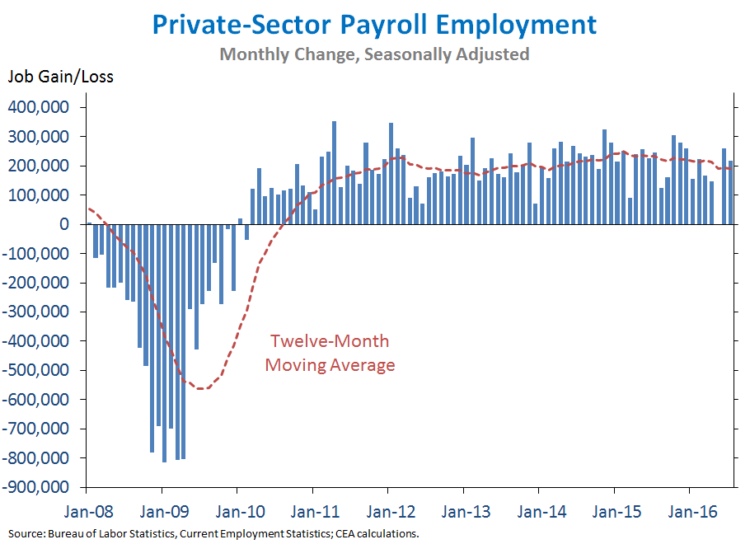
1. U.S. businesses have now added 15.0 million jobs since private-sector job growth turned positive in early 2010. Today, we learned that private employment rose by 217,000 jobs in July, following a similarly robust gain of 259,000 jobs in June. Total nonfarm employment rose by 255,000 jobs in July, above the pace of recent months and substantially higher than the pace of about 80,000 jobs per month that CEA estimates is necessary to maintain a low and stable unemployment rate given the impact of demographic trends on labor force participation. Total job growth for May and June was revised up by a combined 18,000 jobs. The unemployment rate held steady at 4.9 percent in July, and the labor force participation rate ticked up to 62.8 percent—the same rate as in October 2013 despite the aging of the U.S. population putting downward pressure on the participation rate. So far in 2016, nominal earnings for private-sector workers have increased at an annual rate of 2.9 percent, and wage growth over the past year is tied for the fastest twelve-month pace since the start of the recovery.
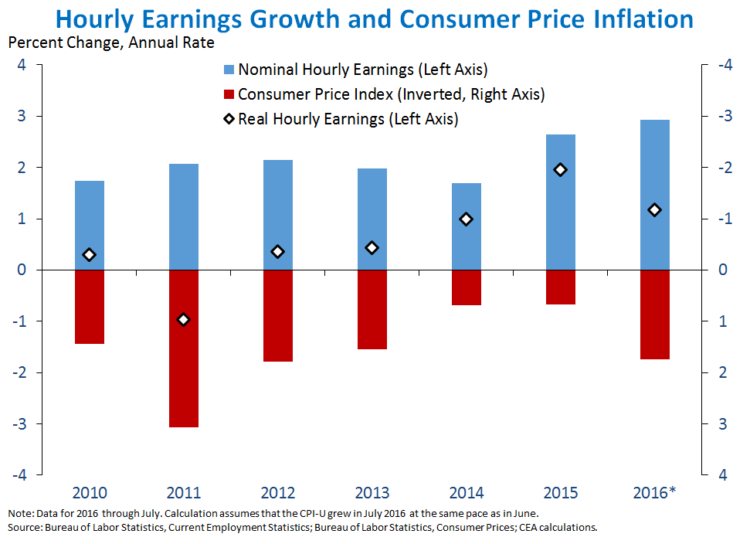
2. Nominal hourly earnings for private-sector workers have risen at an annual rate of 2.9 percent so far in 2016, well above the pace of inflation. Over the past twelve months, nominal hourly earnings for all private-sector workers have increased 2.6 percent, while consumer prices have risen just 1.0 percent over the past year (through June, the most recent data available). As the chart below shows, nominal hourly earnings have grown faster than consumer prices each year since 2012, translating into real wage gains for American workers. While nominal wage growth has been faster so far in 2016 than in 2015, consumer price inflation has picked up slightly as energy prices have moderated somewhat after falling sharply in 2014 and 2015. Nevertheless, real wage growth—a key component of rising living standards—has broadly picked up over the last three years as the recovery in the U.S. labor market has strengthened.
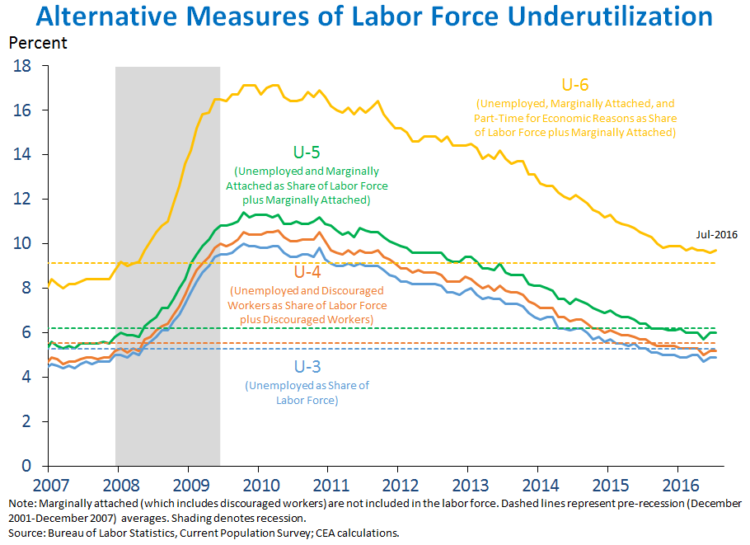
3. Broader measures of labor underutilization have steadily improved, and most are below pre-recession averages, although the broadest measure remains slightly elevated. The headline unemployment rate, the U-3 rate—which includes unemployed persons who have looked for work in the last month—has fallen from a peak of 10.0 percent in 2009 to 4.9 percent in July, below its pre-recession average. Broader measures of labor underutilization tell a similar story. These measures each include a progressively broader group of individuals: U-4 counts discouraged workers in addition to the unemployed, U-5 adds in others who are marginally attached to the labor force, and U-6 also includes people working part-time who would prefer a full-time job (“part-time for economic reasons”). All of these measures also saw large increases during the recession, with the U-6 rate in particular reaching a record high. However, U-3, U-4, and U-5 all recovered fully to their respective pre-recession averages in the summer of 2015 and have fallen further since. The U-6 rate—which ticked up to 9.7 percent in July—is now the only broader measure of labor underutilization that remains above its pre-recession average. This remaining elevation is entirely attributable to the fact that, despite steady improvement, the large increase in people working part-time for economic reasons in the recession has not been fully reversed.
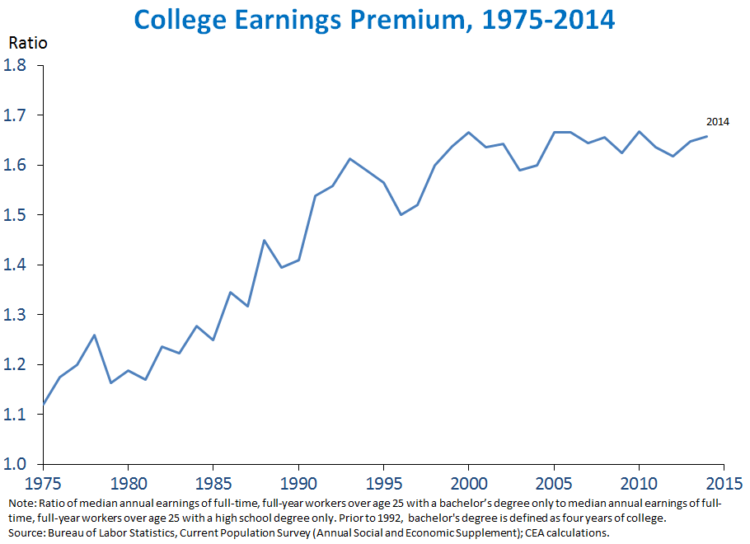
4. The college earnings premium—the ratio of earnings for those with a college degree to earnings for those with a high school degree—has risen over the last four decades, highlighting the continued importance of investing in higher education. As discussed in a recent CEA report, the college earnings premium has reached historical highs in recent years, reflecting a trend over several decades of increasing relative demand for skilled workers. In 2014, the median full-time, full-year worker over age 25 with a bachelor’s degree earned nearly 70 percent more than a similar worker with just a high school degree. Moreover, those with a college degree are more likely to be employed: in July 2016, Americans with a bachelor’s degree or higher were 18 percentage points more likely to be employed than high school graduates. As a result, higher education may be the single most important investment that young Americans can make in their futures. While these data suggest that the overall return to a college education is near historic highs, there is meaningful variation across individuals, largely related to the schools students attend and the programs they select. In particular, evidence suggests that the relatively low returns at for-profit colleges are increasingly becoming a cause for concern, especially given the high rates of borrowing by students at those schools. The rise in student loan debt in recent years has created challenges for some borrowers, and the Administration has taken steps—including creating options like the Pay as You Earn (PAYE) plan, which caps monthly student loan payments at 10 percent of discretionary income—to help borrowers manage debt after college.
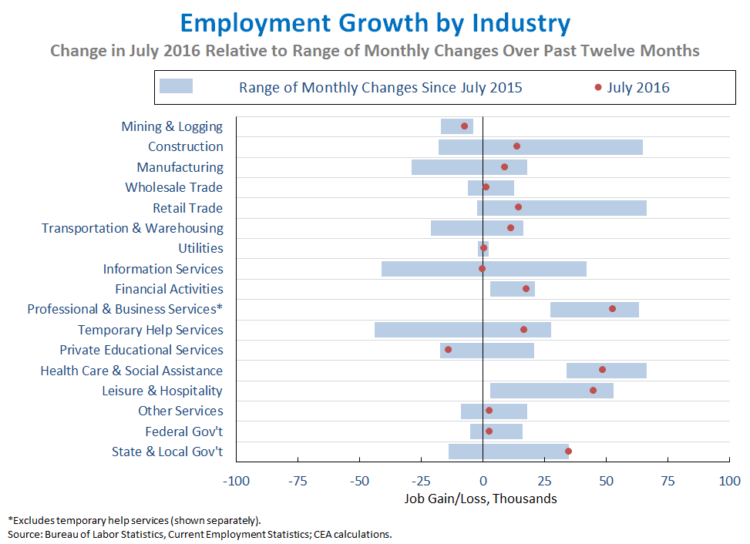
5. The distribution of job growth across industries in July was consistent with recent trends. Above-average gains relative to the past year were seen in industries such as financial activities (+18,000), professional and business services (+53,000, excluding temporary help services), and State and local government (+35,000). Most other industries grew in July at roughly the same pace as in the last twelve months, though private educational services (-14,000) and wholesale trade (+2,000) saw weaker-than-average growth. Manufacturing still faces global headwinds, but showed somewhat better growth in July (+9,000) compared to the past year, and mining and logging (which includes oil extraction) posted a smaller loss (-7,000) than in recent months. Across the 17 industries shown below, the correlation between the most recent one-month percent change and the average percent change over the last twelve months was 0.84, somewhat above the average correlation over the last two years.
- Source Links – August 29, 2020
- About Pat Warde: Eulogy Tribute by Eleanor Hughes – April 1, 2019
- Editorial Note – January 15, 2019
You must be logged in to post a comment Login