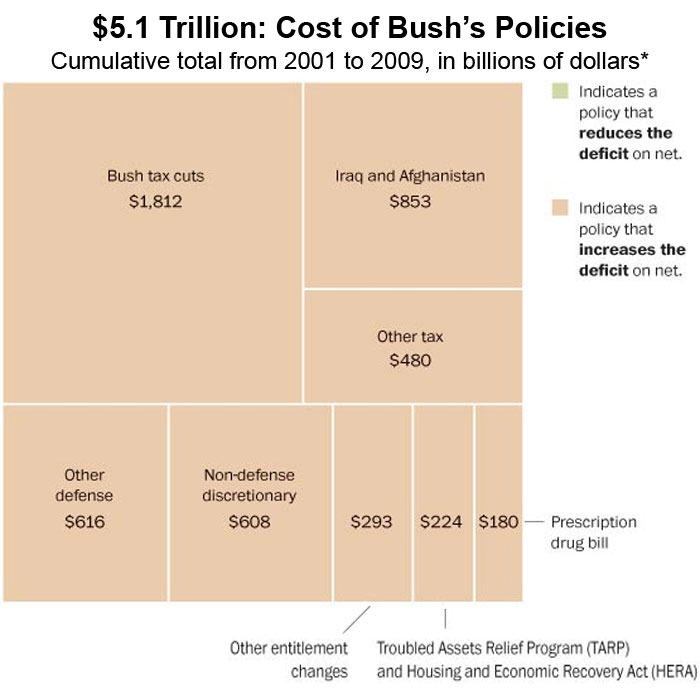
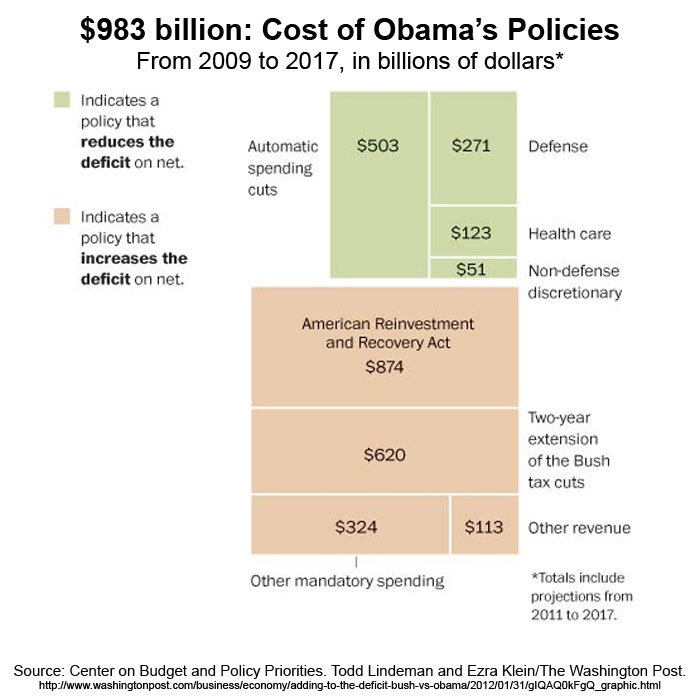
Thanks to the Center on Budget and Policy Priorities and Ezra Klein of the Washington Post, MSNBC, Bloom and Wonkblog, we now have a great chart explaining Pres. G.W. Bush and Pres. Obama and their role in the creation of America’s budget deficit.
When Obama first took office he inherited a $10.5 trillion dollar debt and as of 2012 the debt has increased to about $15.2 trillion. Obama’s detractors use simple subtraction to come up with a differential of $4.7 trillion and assign that figure to Obama. To get a more accurate picture of the deficit, one must look beyond basic arithmetic to determine exactly how much of that debt is attributable to policies passed by Obama and which are the result of a continuation of past policies and the financial crisis.
Ezra Klein, working with the Center on Budget and Policy Priorities has created the helpful chart below to help you understand the actual price tag to legislation passed by Bush and by Obama. As the chart demonstrates, Bush’s policies increased the debt by more than $5 trillion while Obama’s policies have increased it less than $1 trillion.
For more information be sure to check out Ezra Klein’s article Doing the math on Obama’s deficits.


You must be logged in to post a comment Login